Office of Data and Evaluation
Who We Are
The Office of Data and Evaluation creates, develops, and produces agencywide data reports and program evaluations. Data and Evaluation performs research, conducts reviews of best practices and supports program design. Data and Evaluation partners with the Contracts, Finance staff and external partners to support agency contracts. The Office of Data and Evaluation's overall aim is to conduct data analysis that informs and supports decision making.
Agency Data Portal
Welcome to the ACSSA Data Portal – your gateway to understanding how social services support our community!
What is this portal?
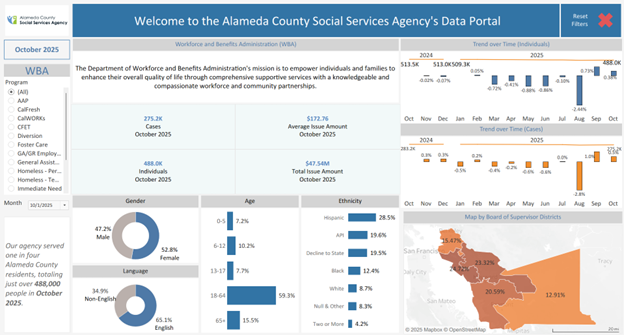
The ACSSA Data Portal is an interactive dashboard that provides transparent, real-time data about the social services programs serving Alameda County residents. Currently featuring data from the Workforce and Benefits Administration (WBA) department, this portal helps community members, researchers, and stakeholders understand who we serve and how programs are performing.
How to Use the Portal: A Simple Guide
Understanding the Layout
The portal is organized into clear sections:
- Top Summary Cards – Quick overview of total individuals, cases, and benefit amounts
- Demographic Charts – Visual breakdowns by gender, age, language, and ethnicity
- Trend Graphs – Track changes in individuals and cases over time (2024-2025)
- Geographic Map – See service distribution across Board of Supervisor Districts
- Detailed Data Tables – Explore specific breakdowns by demographics
Using Interactive Filters (Slicers)
The portal's power lies in its interactivity. Here's how to customize your view:
🔹 Program Filter (Left Sidebar)
- Click on any program name (AAP, CalFresh, CalWORKs, etc.) to view data for that specific program
- Select "(All)" to see combined data across all programs
🔹 Month Selector
- Use the dropdown menu to view data from different months
🔹 Visual Elements as Slicers Click directly on any chart element to filter the entire dashboard:
- Gender Chart: Click "Male" or "Female" to filter all data by gender
- Age Bars: Click any age group (0-5, 6-12, etc.) to see data for that age range
- Ethnicity Bars: Click on specific ethnicities to focus on those populations
- Language Pie Chart: Select "English" or "Non-English" speakers
- Map Regions: Click on geographic areas to view district-specific data
Pro Tip: Click multiple elements to combine filters! For example, select "CalFresh" + "18-64 age group" + "Hispanic" to see data for Hispanic adults in the CalFresh program.
Resetting Your View
To start fresh, click the "Reset Filters" button in the top-right corner (red X icon).
Navigating Between Views
Use the tabs at the top to switch between:
- Overview Dashboard – Summary statistics and trends
- Program Detail – Detailed demographic breakdowns by program
Why This Matters
This portal represents our commitment to transparency and data-driven service delivery. By making this information accessible, we empower community members, partner organizations, and policymakers to:
- Understand service needs across different populations
- Identify trends and emerging challenges
- Make informed decisions about resource allocation
- Hold us accountable for equitable service delivery
Questions or Feedback?
The portal is continuously evolving based on community needs. Your input helps us improve! Email: ssa.data@acgov.org
Link to the portal dashboards: ACSSA-Data Dashboards